

BIT-101
Bill Gates touched my MacBook Pro
I always have different ideas in the back of my head - techniques that I am aware of and want to implement someday but haven’t gotten around to. Drawing contour lines on some kind of height field has been on that list of ideas for at least a couple of years now. I’ve made some attempts to figure it out on my own, with some level of success, but never really accomplished anything worth talking about.
Just so we’re on the same page, here’s what I’m talking about:
You have some kind of 2D field data. It could be elevation data from a government survey, or satellite imagery, or a Perlin/Simplex noise field, a grayscale image meant to encode height/distance, or some other kind of algorithmically generated data. Let’s say this is in a 2D array of floats, so you can get any value by saying data[x][y]. If this is noise data, it could be directly rendered like this:

This was rendered with a resolution of 10 pixels, which is why it’s blocky. Good enough for our purposes though. Although this is rendered visually, think of it as a 2D array of values, like this:

In this case, I have it set so that each value in the array is from 0 to 255, but it can be whatever you want.
What we want to do is draw contour lines for all the data points at a certain “height” like you’d see on a topographic map. Like this:

A couple of weeks ago I was looking over the links on Mary Holstege’s site (a great resource by the way) and ran across this post on contours which led me to Paul Bourke’s CONREC post.
Side note: if you’re not aware of Paul Bourke, it’s worth diving deep into his site. So much great stuff there.
Anyway, after reading up on the technique, which I generally understand, I ported Bourke’s C code to Go. There was actually a sample Go implemention listed there, but I always like to write stuff myself and make it my own rather than just importing libraries when possible. I wouldn’t do that on a job necessarily, but that’s my strategy for my creative coding efforts.
I’m not going to go in depth into the algorithm itself. But in short, it divides the field into triangles and for each triangle checks how many points are above, below, or on the current contour level being drawn. Based on that, it can generate two points that serve as one tiny segment of the contour line. When you draw all of those segments, you get the contour lines as seen above.
And you have to do this for each contour level you want to map. For example, here is the single contour for a value of 128, middle gray in the noise field:

And here it is for the value of 200, which is a much lighter area:

The CONREC formula has you pass an array of contour values that it will iterate over. In the first contour image above, I passed an array of 10 values from 0 to 255. Here it is with 20 contour levels.

So that’s the basic algorithm. Now I’ll go into a bit more of what I added to it.
My Go implementation of CONREC was mostly a straight port of the C code. I did make some changes to make it more Go idiomatic, and tried to simplify a few aspects.
One of the first things I did was to make a helper function for creating the levels array. So I can call makeLevels(count, min, max) and it will generate an array of the given size with values in the given range. For example, running makeLevels(10, 0, 255) which is what created the first contour image above, results in the array [0 28.333333333333332 56.666666666666664 85 113.33333333333333 141.66666666666669 170 198.33333333333334 226.66666666666666 255].
This all worked fine, but one thing I was not thrilled about was the fact that each of these segments was drawn all by itself. They were rendered in grid order, and by contour level order, so there was no concept of one of those contour loops being a single entity. I wanted to turn this into a list of paths, where each path was a list of 2D points I could then connect, maybe changing the color or thickness of, transforming in some way as needed. That wasn’t possible in the code as given.
So I changed it up so that instead of drawing each segment as soon as it was found, I created segment objects composed of two 2D points. So that for each contour level, there was a list of segment objects relating to that level.
But these were still unordered lists of segments, not continuous paths. The next part was the biggest challenge, and the most rewarding.
For each contour level, I had a list of segments that I wanted to turn into a list of paths. For example, looking again at contour level 128,
… you can see that there are six discrete paths there. Each one starts and ends on one edge of the canvas. For contour level 200,
… there are eight paths. Some of them intersect and edge, some just loop back to themselves, a couple almost join (or maybe there’s three there… or maybe they overlap. I’m not sure.)
What I ended up doing:
As is, the algorithm generates a whole lot of segments, which means each path contains a whole lot of points. For the above example with 10 contour levels, there were a total of 5,794 points in all the paths. That’s not horrible, but a 10-pixel resolution is kind of chunky. As you increase the resolution, the number of points explodes. And most of those points are very, very close together, or almost directly in the same line, so they are not adding a lot of value.
Fortunately, I had just tackled this problem! See my post from just a few weeks ago, Simplifying Paths. So this was a no brainer. Once I created each path as just described, I ran autosimplify on it. This brought the total number of points in the example down from 5,794 to 1,812. And in some cases it actually looks better, because sometimes when you draw a path through very close points you can get some artifacting.
In many cases, all I wanted to do was draw each path as shown above. But I might want to do something different for the set of paths in each level. Maybe color them differently. To accomodate both of these needs, the return value from my contour function returns an object with two properties. One is a flat list of all the paths. I can loop through and draw them all as per above. The other one is an array of levels. Within each level element is the list of paths for that level. So I can now do something different per level now. Here, I colored each one differently:

Here, all the orange lines are at low levels. The dark blues are at higher levels.
Or, I can generate elevation markers like you’d see on an actual topographic map.

At this point, I feel like I should remind the reader that we’ve been working in 10-pixel resolution this whole time, and as mentioned, it’s a bit chunky, but good enough for a demo. But you can change that resolution and make everything much smoother:

As described, this method takes in a 2D array of floats representing height data. But how do you generate that data? Obviously, you can generate it algorithmically using Perlin or Simplex noise or some other technique. Or you might be able to download some elevation data somewhere. But a common use case is to pull the height data from an existing bitmap image.
To that end I created a few new functions that can generate a height array from an existing image on disk, or from the current state of the canvas. In fact, that’s what I’ve been doing in the above examples - drawing the noise field and then pulling the height data from that.
To test that, I downloaded this random height map image from the web:

I loaded it in and adjusted the gamma somewhat to make a it a bit brighter.
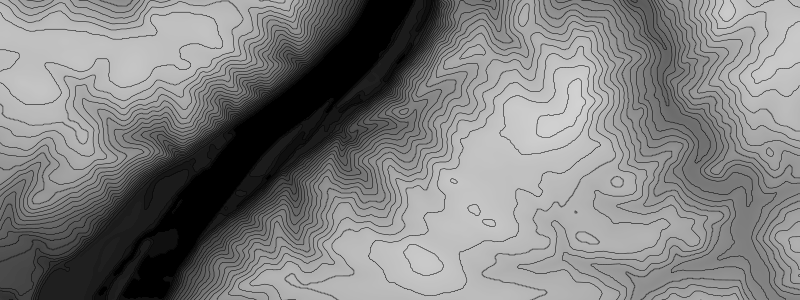
I used my new height data function go get the levels and used that data to generate the contour lines:

Upping the number of countour levels to 32 really brings out details. Note, this was done with 1-pixel resolution.

I will say that at 1-pixel res and 32 levels, this took a few seconds to render (around 5). So, there’s room for optimization, but all in all not horrible as it is.
All my code for this is in my bitlib and blcairo repos. Specifically:
In addition to that, there was another article that I’d bookmarked a while ago on the subject but never got around to reading: Meandering Triangles
Just as I was sitting down to write this post, I pulled it up and scanned through it. I was pleased to see that the main algorithm was roughly the same as CONREC, but more pleased to see that the author had converted the points into paths in fashion quite similar to what I had done. I’m going to have to read this one more deeply, because I feel there may be some good things to learn there, and improve my own code.
Comments? Best way to shout at me is on Mastodon ![]()